

How we got hooked on FiveThirtyEight
How we got hooked on FiveThirtyEight
A little poll aggregation & forecasting history

I wrote a book chapter in 2015 on the rise of poll aggregation and election forecasting. I had been at HuffPost doing aggregation and forecasting for a little more than a year when I finalized the chapter (according to my file save dates). At that point, the cottage industry was on a fast growth path after forecasting successes in 2008 and 2012. We had not yet crashed into 2016 and 2020. In fact, my final save date is June 24, 2015, less than two weeks after Donald Trump’s escalator ride to his candidacy announcement.
Anyway, I’m posting excerpts from the chapter here, because I think it’s interesting to review how we got here in light of the news of widespread layoffs at FiveThirtyEight and Nate Silver’s impending departure.1 Nate didn’t start the enterprise of aggregation, but he certainly took it to a whole different level when he turned it into forecasting.
Pay special attention to some of what I wrote about the future:
Media forecasts for major elections could become necessary in the same way as polls, but it is also possible that more forecasts would flood the market and the “bubble” of election forecasting popularity could burst, particularly if forecasts are not as accurate as they have been in 2008, 2012, and 2014.
If poll data quality wanes aggregation cannot fix it, and forecasts will be wrong when the polls are wrong no matter how complex or cautious the forecasting model.
The future of aggregation and forecasting is completely dependent on the future of polling.
I swear I wrote that in 2015, y’all.
Anyway, the full chapter can be found in the Oxford Handbook of Polling and Survey Methods. (This post is only about 1/2 of the original draft.)2
I think there is a space for aggregation work that needs to be filled, particularly if FiveThirtyEight goes completely under. I have some criticisms of FiveThirtyEight’s methods, but their aggregates are better than nothing. It’s a really useful enterprise when done well. And yes, I’ve been very close to getting back in the game. The bubble might have burst, but that just means not everyone needs to be doing it. The right people need to be doing it.
The Rise of Poll Aggregation and Election Forecasting
The public face of polls and elections fundamentally changed in 2008 when a statistician named Nate Silver, who had been busy forecasting the performance of Major League Baseball players up to that point, created a mostly poll-based forecast of the presidential election on a blog he called FiveThirtyEight. The attempt to forecast elections was not in itself a new idea; academic political scientists had been producing electoral forecasts for quite some time. But how Silver presented it to the public generated tons of attention from non-academic audiences and changed how elections and polls are covered in the media. In only a few years, election forecasts became highly valued and a necessary component of election coverage for some media outlets.
By 2012, academics were publicizing their forecasts on blogs and websites, The New York Times was hosting FiveThirtyEight, and The Huffington Post Pollster added a forecast to its repertoire. In 2014, five media outlets produced forecasts for the Senate elections that calculated the probability that Republicans would take over the Senate majority.
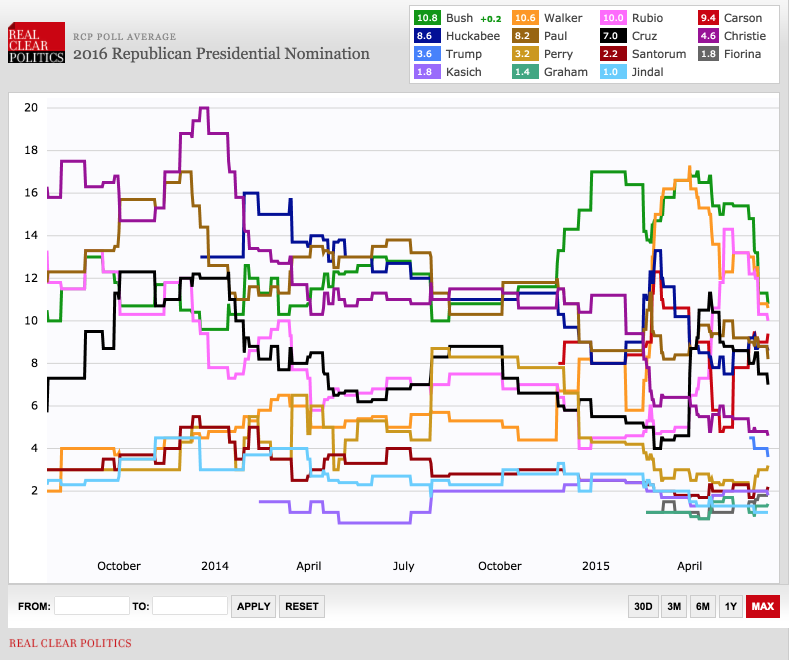
It may seem like Silver's popularity came out of nowhere in the late 2000s, but the groundwork for his success had been laid by other developments. Advances in polling methodology and technology had resulted in a large influx of election polls, especially since 2000, and the questions quickly became which polls to believe and how to know which numbers are right. In response to these questions websites providing polling averages began to pop up, most prominently Pollster (now part of The Huffington Post) and Real Clear Politics, with the goal of providing a single estimate for an electoral contest. Poll “aggregation,” as it became known, was the intermediate step between reporting single polls and using all polls to generate a forecast for an election.
Polling Developments, Aggregation, and Forecasting
Election polling methods were developed throughout the 1930s and 1940s, and some of the first efforts were complete failures. The process of obtaining a representative sample of voters for any contest was complicated and expensive, and required face-to-face interviewing in which a trained interviewer had to find randomly selected respondents and administer the survey. Eventually, however, household telephones became ubiquitous enough that instead of face-to-face interviews, pollsters could have interviewers call house phones and do an interview without leaving the office. In the 1960s and 1970s, more pollsters emerged and polling reliability increased as telephone interviewing became the standard.
By the 1980s nearly 100 percent of American households had at least one phone line. Getting a good sample of phone numbers was simple, and the race to improve calling efficiency and data collection speed was on. In the 1990s, computer-assisted telephone interviewing became the norm as software developers created systems that would dial phone numbers and record data from an interview.
Computer technology continued to improve the efficiency of polling operations. Auto-dialers, programs that would automatically dial a phone number but only connect the call to a live interviewer if a person answered the call, greatly increased efficiency by eliminating the need for interviewers to sit in silence listening to phones ring endlessly. Some pollsters went even further: To circumvent the costs of employing interviewers to conduct the polls, automated voice technology was adapted for polling purposes. A recording would read respondents questions, and they would answer using buttons on a touchtone phone.
Polling was getting easier and cheaper -- which meant more companies wanted to get in the game. The number of national-level presidential election trial-heat polls skyrocketed as much as 900 percent between 1984 and 2000, and continued to expand in the 2000s when Internet polls came on the scene. The industry suddenly had an entirely new mode of interviewing people that was fast and cheap, albeit with considerable coverage issues.
As the volume of polling and number of pollsters increased, poll watchers faced a problem: When several polls all have different estimates, which set of numbers is right? How could a consumer even find all of the available polls? Poll aggregation and averaging offered some answers.
Aggregation
The Internet not only offered a new mode of collecting information, it offered a place to store and display that information. Early in the 2000s, a handful of websites emerged dedicated to collecting all available polling data and attempting to help consumers make sense of it. Real Clear Politics came online in 2000, and Pollster (originally Mystery Pollster, and now part of The Huffington Post) began collecting polls in 2004.

The goals of these sites were simple: Create a one-stop shop for information about pre-election polling, the polls themselves, and provide a simple explanation of what the polls say about the electoral contest. The key difference was that Real Clear Politics tended to focus its analysis on the campaigns and political side, while Pollster focused analysis on the polling and methodology used to collect the data. Both sites eventually began to produce poll averages as parsimonious indicators of what was happening in the race. Instead of trying to choose which one poll to believe, these averages offered a single set of numbers that took multiple polls into account.
The sites took different approaches to averaging. Real Clear Politics used a simple average of the last five polls for that particular electoral contest in its database to generate overall estimates. Pollster created charts using all of the polls, plotted by the dates they were conducted, and then used a regression technique to estimate a poll average -- illustrated as a line on the chart -- to show what the estimated average was over time. The statistical implications of each averaging technique will be discussed in the next section. Although these methods differed significantly in execution, the end result was a way to look at many different polls and make sense of the information.
In recent years, more websites have begun collecting and aggregating polls. Five Thirty-Eight and The Daily Kos track polls, although mostly for use in their forecasting models, and other sites often emerge during election seasons. The methods for aggregation have gotten more complex (although the simple ones described above are still used) in order to calculate confidence intervals and the probability of a candidate winning. But the first polling averages paved the way for poll-based forecasts by developing the concept of pooling all of the polls into a “model” of sorts that would use the power of all the available polling information to understand what was happening in a race.
Forecasting
The inevitable question that emerged from poll aggregation was this: If all of the polls put together say x, then what does that say about the future election outcome? Academic political scientists had been using various data sources -- some including polls, some not -- for many years to forecast electoral outcomes by the time Nate Silver's forecast attracted public interest in 2008. Some of the academic forecasts were cited in blogs and news sources, but had remained mostly constrained to the meeting rooms of the American Political Science Association and its smaller affiliates. Scholars were doing tremendous work, but the forecasts were typically static -- there was one forecast calculated once. Silver not only packaged his forecast well on his blog, but it was a continuously updating forecast that practically demanded constant attention from political junkies.
Silver benefitted from great timing. There was no shortage of poling data by 2008, and new polls were released at least every week, sometimes every day close to election day. Combined with the information political scientists had honed about the “fundamentals” that affect presidential election outcomes, such as economic indicators and the sitting president's approval ratings, there was a lot of quantitative information about the election to utilize in a forecast.
It probably helped that the 2008 presidential contest commanded more attention than recent elections, in part due to Democratic nominee Barack Obama's popularity with young and minority voters. People were willing to log onto a website to see if the projections supported the enthusiastic “hope and change” campaign. Silver's predictions did indeed favor Obama, and those predictions were correct. The model predicted the election's outcome in 49 of 50 states and correctly predicted that Obama would win. The forecast was viewed as a huge success.
As with any successful venture that generates a lot of Internet traffic, people begin to look for ways to replicate that success. The New York Times took over hosting Five Thirty-Eight and Silver became a full-time blogger. By the 2012 election, two other independent blogs run by Princeton University professor Sam Wang and Emory University Professor Drew Linzer were running forecasts, and Stanford University political scientist Simon Jackman produced a forecast for Pollster, now part of The Huffington Post. Most of these forecasts were very accurate; in fact, Silver, Jackman, and Linzer correctly predicted all 50 states; Wang only missed Florida, which had a razor-thin margin and couldn't be called on election night.
In 2014, the expansion continued and more media outlets got into the forecasting game for the midterm Senate elections. Everyone wanted to know whether the Republicans would take over the Senate. This time five separate media outlets had their own forecasts. The Washington Post got into the game via an academic blog called The Monkey Cage led by George Washington University Professor John Sides, Five Thirty-Eight became its own data journalism website under the auspices of ESPN and ABC, and Linzer, by then an independent statistician, worked with The Daily Kos. The New York Times and The Huffington Post (Pollster) hired data scientists to work on their forecasts. Wang ran his forecast again at The Princeton Election Consortium.
In the future, more media outlets and more academics could get into the public forecasting game. There might not be much utility for consumers in increasing the number of forecasts, a point that will be discussed in the section on controversies, but the technology needed to do the statistics required for these forecasts is becoming easier and easier to access even as the methods of aggregating and forecasting have become more complex.
Challenges in Aggregation and Forecasting
Explaining models, “priors,” and Markov chains to a nontechnical audience is no small feat, but from the beginning Silver and other forecasters have prided themselves on transparency about their methods. Most of the forecasters active in 2014 posted their code and data online so that those with the requisite statistics background could see it for themselves. However, for those without the statistics background, the details of a complex forecasting model are often completely foreign. The nuances of statistical modeling, and especially the uncertainty associated with statistics, can easily get lost in the race to say “Obama will win in 2012” or “Republicans will take over the Senate in 2014.” How to effectively communicate about the statistics and uncertainty of the models to a lay public has become a considerable challenge in election forecasting. The first part of this section will identify a few ways audiences can identify reliable aggregations and forecasts, but the bulk of the focus will be on how aggregators and forecasters can communicate with the audience and tackle the challenges inherent in this type of work.
Communicating uncertainty
Explaining the uncertainty of probability-based forecasting to the general public is a task that has flummoxed scientists, and particularly weather scientists, for many years. Social scientists moving their work into a more public domain are seeing the difficulties first-hand. It seems no matter how many times a political pollster, aggregator, or forecaster reminds the public that polls have margins of error and forecasts are based on uncertain probabilities, the media and the public want to read the numbers as completely certain, and then castigate the analysts if the outcome is different from their expectations -- or even if some other pollster or analyst says something different.
Despite these misunderstandings that can seem impossible to overcome, aggregators and forecasters still have the responsibility to communicate as clearly and effectively as possible about their estimates. The margin of error is probably the most misunderstood concept that aggregators have to deal with, and the process of averaging or smoothing multiple polls makes it even more complex. Forecasters mostly deal with misunderstandings about probability and precisely what it means to say a given event has a certain probability of occurring.
Margin of error is difficult because it is often used as the catch-all for polling error, assumed to stand for all possible error in polls, but it is actually only one specific type of error. It is a measure of only the error produced by interviewing a random sample rather than the entire population whose opinion you want to know. Other types of error -- if the entire population was not available to be sampled, if the measures were not quite right, if there are systematic differences between the people who answered and the people who did not answer the survey, or if there were mistakes in weighting the data or identifying likely voters -- are completely unaccounted for by the margin of error. If a poll does not use a random sample, as Internet-based panel surveys do not, some question whether the margin of error is a valid measure of uncertainty at all.
Despite the controversy, most pollsters provide a margin of error with their polls, but these apply only to those specific polls. When aggregators begin putting polls together in order to estimate a poll average the margins of error for the individual polls become largely meaningless, yet there is still uncertainty in the aggregated estimate. Pooling polls does not eliminate uncertainty, although it should reduce uncertainty in theory. The aggregated estimates at Real Clear Politics do not report any measure of uncertainty since they use a simple average of the last few polls. The simplest way to discuss uncertainty would be to calculate, report, and explain the standard deviation of each poll from the average.
The Huffington Post Pollster charts that rely on LOWESS techniques do not show measures of certainty, but their Kalman filter model-based averages do illustrate the uncertainty of the estimate, as described in the technical section. The model-based averages pool the polls in a way that incorporates sample sizes for each poll and its respective margin of error, so polls with larger samples and more certainty have more influence over the average. The average itself, then has error from the individual polls and the simulation process. However, users looking at the charts would not necessarily know that -- it is not indicated anywhere, and the explanation of how the model-based averaging works is buried in the archives.
Forecasters, on the other hand, do not necessarily need their audience to understand the intricacies of polls and margins of error, unless the forecast is completely poll-based, but do need to effectively communicate what probabilities mean. All of the major media forecasts for 2014 measured the outcome in terms of the probability that the Republicans would take over the majority in the Senate. Some, like The New York Times forecast, included qualitative terms with the numbers indicating a how strong the chances were of a Republican takeover. Many simply reported the probabilities in percentage format and left the audience to determine what a 65 percent chance of a Republican takeover meant. There was a lot of Internet ink spilled explaining that a 60 percent chance of winning is not substantially different from a 50 percent chance of winning.
Most forecasters did explain the uncertainty of the forecasts, often in great detail. However, these discussions of uncertainty were typically buried in long discussions of the methods used to generate the estimates -- which most people will not read all the way through -- and the message was easily lost. For example, the methods explanation for FiveThirtyEight's 2014 Senate model was around 10,000 words and requires a commitment of about an hour to read. The Huffington Post's 2014 forecast model explanation was shorter, around 2,500 words, but still required more time than most casual news consumers are likely to spend. The (probably large) portion of the audience who went directly to the forecast pages, ignoring the methods explanations, saw numbers that declared how likely the Republicans were to take over the Senate without any explanation for what an 80 percent likelihood actually means. Presenting the numbers with the appropriate explanation of uncertainty, without requiring the audience to spend an hour reading model details, is something public forecasters will need to work on in the future.
There is a big opportunity to educate the public about statistics and probability; political aggregation and forecasting is a huge connection between the public and political science that happens every two years, and in a bigger way every four years. The difficult part of the task is figuring out how to do that in a clear and concise way, and then getting audiences to read the explanations.
Single polls vs. aggregation
There is a bit of tension between pollsters and aggregators. Aggregation can seem to render individual polls moot in promoting an average instead of any single pollster's estimates. Pollsters rely on their branding to attract business, and aggregation removes that branding and replaces it with an average of several brands. The pollster is still recognized as part of the average, but the average can seem to diminish the importance of the individual poll. Additionally, the claim that aggregation results in a more precise estimate of where public opinion stands than individual polls can seem like an attack on the accuracy of individual polls. Each of these criticisms deserves attention.
The obvious answer to the notion that aggregation renders individual polls moot is that aggregation could not exist without individual polls. Aggregation is only possible when there are multiple pollsters measuring the same question; without the pollsters, aggregators have no job. Beyond the obvious, though, individual polls have an advantage over aggregation in showing actual change in opinion over time. Aggregation will, of course, show change in estimates over time, but the change could be due to which polls were in the past five polls average, or which were most recent and therefore weighted most heavily. When aggregations combine polls with sometimes very different methods it becomes difficult to say what changes in the estimates are due to actual opinion change and which are due to polling method differences.
With individual polls, change in opinion over time becomes easier to detect. Two polls produced by the same pollster with the same methods that differ only in when they were conducted will offer a much clearer idea of how opinion has changed. If it is not a panel, that is, the samples in the two polls are different, some of the difference in numbers between the polls could be sampling error. But sampling error has known estimates, so this can be accounted for with simple statistical testing. If opinion in the second poll has changed from the first poll, and that change is statistically significant after accounting for sampling error, there has probably been an actual opinion shift in the population. The equivalent tests for aggregated estimates would be much more difficult, meaning that it is less clear that opinion has actually changed from time 1 to time 2. Aggregation will pick up opinion change patterns over the long term, but individual polls conducted by the same pollster are much better for identifying opinion change as it is happening.
The idea that aggregation as a more precise estimate of opinion than individual polls attacks the accuracy of individual polls is warranted, but a bit misguided. Aggregators are not claiming that individual polls are inaccurate by combining the polls; rather, they are leveraging large amounts of information to improve statistical precision. It is statistical fact that a single poll with a fixed sample size of approximately 1,000 respondents has a 95 percent confidence interval margin of error around 3.4 percentage points (without including any design effect in the margin of error). The margin of error cannot be reduced in this poll once it is completed, meaning that in 95 percent of all possible samples the estimates will vary by up to 3.4 percent above or below the estimate obtained with the poll's sample. In the other five percent of cases, estimates would exceed that 3.4 percent error.
The only way to improve precision is to increase the sample size. Aggregators are able to effectively increase the sample size by combining several polls, thus decreasing the margin of error. Other sources of error can be introduced in the process, as discussed in the technical section, so the error of the aggregated estimates might not look exactly like a margin of error for a sample size equal to all of the polls' combined sample sizes, but the statistical fact is that more information increases precision of the estimates. This is not an attack on pollsters' accuracy or a comment on the methods they use to get individual estimates. As just noted, aggregators are completely dependent on the pollsters to produce data that can then be aggregated, but aggregators are trying to leverage that information to provide an easy-to-comprehend summary of opinion. In doing that, combining polls does statistically increase the precision of estimates.
In sum, single polls and aggregated estimates each have strengths, and both have flaws. Aggregation is not going to put individual pollsters out of business anytime soon, and individual polls cannot achieve the precision that aggregation can by combining the resources of all polls.
Polls as forecast tools: Expecting too much?
Using polls to forecast elections brings up the question of how well-suited polls are to this purpose. Pollsters are fond of noting that polls are “snapshots” of what opinion looks like at the time the poll was conducted, particularly when electoral results do not quite match what polls said the week (or weeks) prior to the election. They are correct to make that assertion. When polls ask respondents for their opinions, what they get is the opinion that comes to mind at the moment that person is answering the question. Lots of different factors go into how a respondent will answer a question, but the single biggest determinant seems to be what is top of mind when the pollster calls (or emails, or knocks on the door).
We do know that polls are highly predictive of electoral outcomes when the polls are conducted within a few weeks of the election, but the farther out from the election the polls were conducted, the lower the correlation is between outcome and poll estimate. Polls inherently measure public opinion in the past since they can only estimate opinion at the time the questions are asked -- by the time they are released, the data are at least a few days old. Forecasts are attempting to do exactly the opposite: estimate vote choices in the future. The measurement goals of polls and forecasts are fundamentally at odds, and given the “ignore the polls” assertions it would seem that polls are now expected to be forecasts, at least by some experts, in order to have any value. It is critical to keep the goals of polling and forecasting separate, even though polls are almost always a primary data source for forecasts. Polls alone are not forecasts; expecting polls to always predict electoral outcomes is expecting too much.
Polls are, however, appropriate data to use for forecasting. By the end of an election cycle, poll outcomes correlate very highly with outcomes according to Erikson and Wlezien. Most forecasts that begin more than a few months before the election do not actually rely solely on the polls. These models start with the “fundamentals” of the election -- economic factors and presidential approval ratings are the most commonly-used fundamentals -- and blend the polls in as another source of information. As the election gets closer, forecasters assume that people answering the polls begin paying more attention to the campaigns and fundamentals so that the poll numbers align with what the fundamentals would expect. That reduces the importance of the fundamentals, so the forecasts rely more and more heavily on the polls as the election gets closer. As discussed in the technical section, The New York Times, Washington Post, and FiveThirtyEight models used this type of setup, gradually leaning more on polls for their forecasts.
Models that rely only on polls, such as the 2014 models produced by HuffPost Pollster and The Daily Kos are probably more similar to poll aggregation if they are calculated more than a few months before the election. However, in 2014 these models were released later in the cycle. By the time these models debuted in late summer, there were only minor differences between their estimates and the hybrid model estimates that included fundamentals. Since these models were released later and made adjustments to account for the uncertainty of relying solely on polls the expectation that the polls could produce accurate forecasts was appropriate. But more than a few months prior to the election, polls-only forecasts are probably demanding too much from polls that are only meant to measure opinion at the time they are conducted.
The Future of Poll Aggregation and Forecasting
Aggregation is likely to continue as long as there are plenty of polls to aggregate. There is not a ton of competition for audiences, since only two websites produce aggregated estimates and charts of these estimates over time. The idea of doing a “poll of polls” to provide one estimate of where opinion stands remains useful unless the volume of polling slows down drastically in the future.
Forecasts could have a shakier future. Political scientists will likely continue to forecast elections for journals and academic purposes, but media-produced forecasts that need to appeal to a broader audience could face issues if more outlets get into the game. Presumably there is a finite audience that these media forecasts can appeal to because of their complexity. Additionally, in 2014 the concept of aggregation was extended to election forecasts: Vox, a new Internet media source, did not produce its own election forecast but instead aggregated the other forecasts into one meta-forecast. At the point when forecasts are being aggregated, a logical question is whether having so many forecasts is worthwhile, especially if the forecasts mostly say the same thing as they did in 2014. This is an important question to ask since there is a limited consumer market for forecasts.
Forecasting is likely to become more common as statistical tools become more user-friendly due to technological advances, just as polls did in the last few decades. Polls can continue to proliferate since there are different sources of sponsorship and different audiences -- campaigns, parties, and a multitude of news sources will continue to need polls -- but it is less clear that forecasts are necessary to those groups. Media forecasts for major elections could become necessary in the same way as polls, but it is also possible that more forecasts would flood the market and the “bubble” of election forecasting popularity could burst, particularly if forecasts are not as accurate as they have been in 2008, 2012, and 2014. It remains to be seen whether forecasting is a temporary trend or will become a permanent fixture in election coverage.
The futures of aggregation and forecasting are similar in one crucial way: they will always depend on the availability of quality polling data. If poll data quality wanes aggregation cannot fix it, and forecasts will be wrong when the polls are wrong no matter how complex or cautious the forecasting model. Without quality data, we are not able to measure opinion accurately enough to predict anything. The future of aggregation and forecasting is completely dependent on the future of polling.
Please note that while I’m talking about aggregation and forecasting here, the FiveThirtyEight newsroom did much more than that, including some incredibly valuable reporting. The loss of their reporting is significant and sad.
PS - If you see any stray formatting issues, it’s because I copied this over from LaTeX. Leave me a comment, and I’ll fix it.
Hey Natalie: Really enjoying Herding Cats & Polls. Lots of good thoughts that we need right now.
Fantastic.